For the second year running, the RCP has published the data it holds about the diversity of its officers, senior roles, Council and senior staff.
In 2020 we published the report of our equality and diversity review, followed by annual progress reports one year on and two years on. Since then, we have been improving the information we hold. In 2022, in the week that the BMA published a report into racism in medicine, we first published the data that we hold about the diversity of our leadership.
We are now publishing the most recent data we hold. We have again said what proportion of the data we do hold as a ‘response rate’. For both officers and senior roles, and members of Council, the response rate has fallen for several categories. We recognise that we must improve this if we are to monitor this data over time and build up a detailed understanding of our leadership.
Reflections
It is still very clear that Black people are underrepresented in the RCP leadership. As we said last year, this is not a surprise – our recent census shows that only 2.5% of consultants are Black or Black British, compared with around 3.5% of the UK population – but it remains an ongoing source of concern.
The RCP continues to support efforts by medical schools to improve access to a career in medicine for underrepresented groups. It is important that we all do what we can to redress the imbalance caused by barriers for people of some backgrounds. We are supporting the work of the Social Mobility Foundation and others to widen participation.
Ultimately, we need to remove those barriers by removing the structures of our society that cause inequality. All the data show clearly that that there is something about the way our society is constituted that benefits some people and deprives others.
The RCP will continue to highlight the issue by publishing the data we collect and suggesting actions in response. We encourage everyone we work with to do the same.
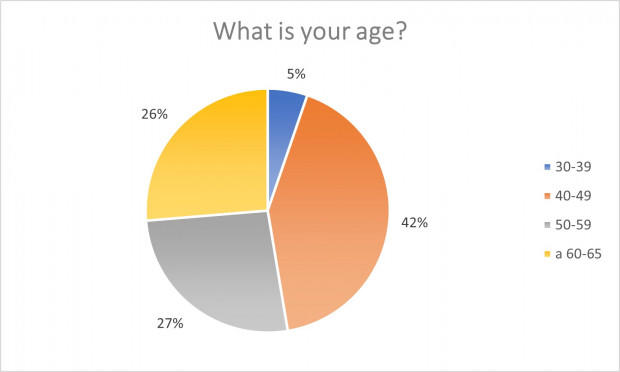
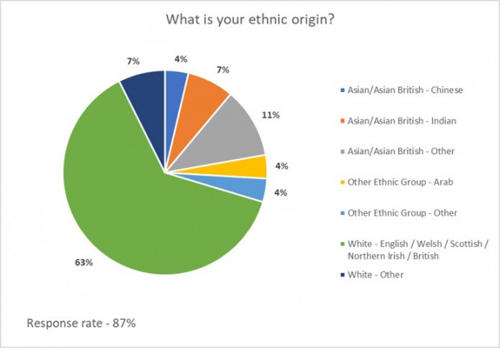
College officers and senior roles
This group includes our senior college officers and college officers and senior roles.
33% are Christian, 33% have no religion or belief, 11% are Jewish, 11% are Muslim, 6% are Buddhist, 6% preferred not to say. Response rate: 58%.

- 56% are men and 44% are women. Response rate: 100%
- 94% describe themselves as heterosexual/straight, and 6% as a gay man. Nobody describes themselves as a as a gay woman/lesbian. Response rate: 58%
- 55% are married or in a civil partnership, 32% other, 3% are single and 10% separated or divorced. Response rate: 100%
- 100% said their gender is the same as was registered at birth. Response rate: 58%
- 50% are the primary carer of a child or children, 33% have no caring responsibilities, 11% are a secondary carer, and 6% are the primary carer of a disabled child or children. Nobody said they are a carer of a disabled or older adult. Response rate: 58%
- 100% are not disabled. Response rate: 58%
- 39% attended a fee-paying school and 61% did not. Response rate: 58%.
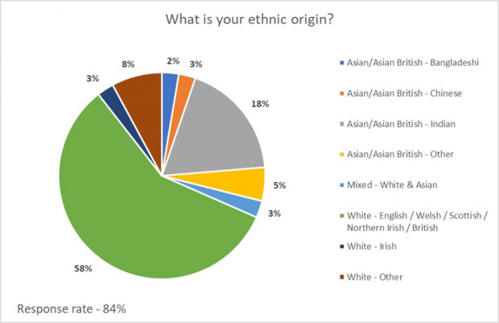
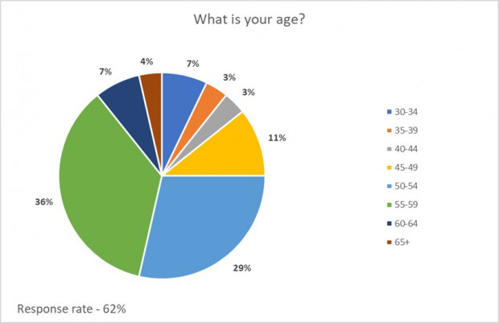
Council
This group includes the voting members of our Council.
29% are Christian, 29% have no religion or belief, 14% are Hindu, 7% are Buddhist, 3% are Jewish, and 4% said ‘other’. 14% preferred not to say. Response rate: 62%.
- 41% are women and 57% are men. 2% preferred not to say. Response rate: 98%
- 86% describe themselves as heterosexual/straight and 7% as a gay man. 7% preferred not to say. Nobody describes themselves as a as a gay woman/lesbian. Response rate: 62%
- 45% are married or in a civil partnership, 30% other, 8% are single, 7% are separated or divorced, 3% are widowed and 2% co-habiting. 5% preferred not to say. Response rate: 89%
- 96% said their gender is the same as was registered at birth. 4% preferred not to say. Response rate: 62%
- 64% have no caring responsibilities, 18% are the primary carer of a child or children, and 14% are a secondary carer. Nobody said they are a carer of a disabled or older adult. 4% preferred not to say. Response rate: 62%
- 86% are not disabled and 7% are disabled. 7% preferred not to say. Response rate: 62%
- 68% did not attend a fee-paying school and 25% did. 7% preferred not to say. Response rate: 62%.
Senior staff
This group includes staff at grades 8 to 10, including heads of service, deputy directors, operational directors, executive directors and the chief executive.

- 63% are men and 37% are women. Response rate: 100%
- 100% said their gender is the same as was registered at birth. Response rate: 84%